• ×
    Information
    Windows update impacting certain printer icons and names. Microsoft is working on a solution.
    Click here to learn more
    Information
    Need Windows 11 help?
    Check documents on compatibility, FAQs, upgrade information and available fixes.
    Windows 11 Support Center.
  • post a message
  • ×
    Information
    Windows update impacting certain printer icons and names. Microsoft is working on a solution.
    Click here to learn more
    Information
    Need Windows 11 help?
    Check documents on compatibility, FAQs, upgrade information and available fixes.
    Windows 11 Support Center.
  • post a message
Guidelines
The HP Community is where owners of HP products, like you, volunteer to help each other find solutions.
Archived This topic has been archived. Information and links in this thread may no longer be available or relevant. If you have a question create a new topic by clicking here and select the appropriate board.
HP Recommended
hp prime

I have an algorithm that is too complicated to write an explicit App plot F(x) function to plot.  Can i create a plot function L(x) in Program mode and assign it to app F(x) as in F1(x) := L(x) and plot it automatically without manually copying the L(x)results in Stat2 App list. Do I need to export L(x)?


thank you, FLIR

9 REPLIES 9
HP Recommended

Yes, however if your function is not continuous it may not give you the results you want. Also, since you won't be able to derive that function some of the things like area under curve and whatnot will not work.


You can define any expression in the stat plotters to provide data - not just a column name.


If you have trouble, post your data and function you've made and I can probably help more if needed.

TW

Although I work for the HP calculator group as a head developer of the HP Prime, the views and opinions I post here are my own.
HP Recommended

Dear TW,


 Yes my L(x) function is continuous and printable in the programa FOR STEP DO loop.  In numeric mode it appears the function L(X) is not defined in the sub interval between steps and the plot routine fails. I tried to command  the x and L(x) at the STEP values using PLOT SETTING but the plot failed.


I am able to plot L(x) at  STEP values by manually copying the values in C! and C2 in APP STAT2 but it sure would be handy to do it automatically like a machine does.  Can that STAT2  plot routine be transferred to APP FUNCTION PLOT routine.


Thank you, FLIR

HP Recommended

I cannot help you without your function and data. There just is not enough information for me to do so. Thanks!

TW

Although I work for the HP calculator group as a head developer of the HP Prime, the views and opinions I post here are my own.
HP Recommended

Within a HP Prime program I have stored my results in a function F3(x) but have not been able to plot F3(x) using the HP Prime Function APP for its vector F(x) functions.  I have been able to plot F3(x) using the HP Prime Stat2 APP by manually copying the x and F3(x) results into  C1 and C2 columns and executing the Plot command on the calculator.


Help needed to automatically plot a stored F(x) function!


Thank You

HP Recommended

Hi!, @flir:


Can you explained better with your's examples ?.


Kind Regards !.
Have a nice day !.
@Maké (Technical Advisor Premium - HP Program Top Contributor).
Provost in HP Spanish Public Forum ... https://h30467.www3.hp.com/
HP Recommended


My suggestion is to add this loop:


LOCAL i,x;

x:=1;     //set the beginning value of x.


FOR i FROM 1 TO 100 DO

  C1(i) := x;

  C2(i) :=F3(x);

   x:=x + .1 ;

END


Thus you write your data to the Statistics 2Var app.

HP Recommended

HP Prime Software Version: 2016 08 29 (10637)


In Program Mode using FOR and STEP and DO i calculate data as a function of variable "x" and deposit data in function L2(x). I wish to automatically plot L2(x) using calculator's Function APP so I assign L2(x) to an available F3(x) function. I use the calculator's Plot Setup key to set the range of x and Y and their tick settings.


I do not see the graphical plot of F3(x). However, in the calculator's NUM mode I see the values of some of the calculated values of L2(x) assigned to F3(x).  The plot routine in the calculator's software version apparently is not able to interpolate the sub interval values to display a connected plot.


I tried to repeat the process with the calculator's STAT2 app plotter but was unable to display a graph.  Howeverm, if I manually copied the x and L2(x) data into the C1 and C2 data columns I then was able to display a graph.


I wish to automate the plotting display of any continuous data I calculate and store in Program Mode.


Thank You

HP Recommended


I do not understand how you could have defined a function with name L2.


L2 is a reserved name for lists, so it can not be the name of a function.


L2(1), L2(2), L2(3)... and so on is possible because it are the elements of a list, but L2(0.5) would not exist, so it can not represent a continuous function.

HP Recommended

It seems to me that you have created a list L2 and want to plot it in the Function app.


The problem is that L2(X) is only defined for positive integer X’s.

We have to find a way to define it for non - integer X’s.


We can use the FLOOR function for this.

FLOOR(X) converts X to an integer value, eg FLOOR(2.73)=2.


So instead of F3(X)=L2(X) we have to write:

F3(X)=L2(FLOOR(X))


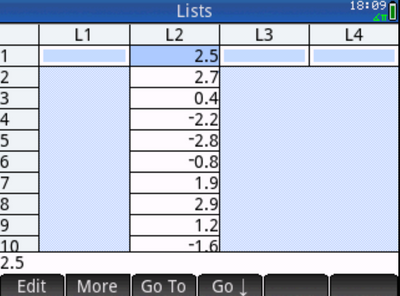
Suppose this is our list:

2017-05-29 18.12.12.png


Then we get:

2017-05-29 18.10.41.jpg


2017-05-29 18.13.46.png


It looks better when we choose in second page of Plot settings:

Method: Fixed - Step  Segments.

Then we see:

2017-05-29 18.15.11.png


It is also possible to plot the list in the Statistics 1Var app and Statistics 2Var app.

Statistics 1Var app is easiest.


If you want to know how to do this just ask it.


Archived This topic has been archived. Information and links in this thread may no longer be available or relevant. If you have a question create a new topic by clicking here and select the appropriate board.
† The opinions expressed above are the personal opinions of the authors, not of HP. By using this site, you accept the <a href="https://www8.hp.com/us/en/terms-of-use.html" class="udrlinesmall">Terms of Use</a> and <a href="/t5/custom/page/page-id/hp.rulespage" class="udrlinesmall"> Rules of Participation</a>.