-
×InformationNeed Windows 11 help?Check documents on compatibility, FAQs, upgrade information and available fixes.
Windows 11 Support Center. -
-
×InformationNeed Windows 11 help?Check documents on compatibility, FAQs, upgrade information and available fixes.
Windows 11 Support Center. -
- HP Community
- Archived Topics
- Tablets and Mobile Devices Archive
- make two plots in hp prime and count steps

Create an account on the HP Community to personalize your profile and ask a question
03-06-2018 11:43 PM
Hi,
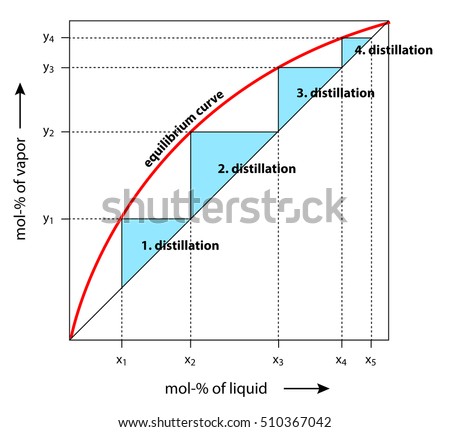
I would like two know how I could generate this graph in the HP prime. Given data points(no functions) for the equilibirum curve (red curve). My problem is I have tried to use the stats2var app but i can only plot 1 curve. how can i plot two and be able to read the axsis so i can determine the points where the red and black curve meet and the number of steps between the curves. it is important that i can read the axsis because in order to find the black curve i must first find the (x,y) where the red and black curve intercept.
in my problem i am given plenty of data points for the red curve but only (x1,y1) and (y2) for the black curve. so i need the x2 where the curves intercept (top right).
below I have posted a picture of what i am tring to generate on the hp prime. I think the squence app has a similar picture but i am not sure if i can use squence app without having the function.
the easiest thinkg for me to do is to use something like excel scatter plot but i am not sure if hp prime spread sheets is that robust.

03-08-2018 11:26 AM
Do I understand you well that when 4 points on the red graph would have coordinates:
(1,3) (3,6) (6,7) (8,7.5)
the coresponding points on the black graph would have coordinates:
(3,3) (6,6) (8,7) ??
In Statistics 2Var this would look like:
03-17-2018 09:48 AM - edited 03-17-2018 09:50 AM
In Plot Settings (Shift-Plot), second page, I checked the Connect box.
Another thing I did was turning off 'Trace' in the menu of Plot View, because I wanted to be able to tap any position on the screen and see its coordinates.
In order to actually see them next tap the 'Menu' button on the screen.

